
Representation Learning As A Scientific Key II: Data
In the analysis of scientific data with machine learning and especially deep learning, the question of representations, the right model and the discrepancy between structured and unstructured data are becoming increasingly important. Further, for the progress of machine learning, the question which forms of data can be processed by which type of model, is also highly interesting. In the next post I’ll give a brief introduction to a highly interessting data source, which ist based on the physical measurement technique of spectroscopy.
The Tricorder of Star Trek:Spectroscopy
Do you remember the tricorder 2 from Star Trek Enterprise, which was used by the Starfleet to collect data about the unknown situtation, which could be a new place or condition of a crew member. I’m not a spectroscopist, but I think that this rather old physical measurement method would have the potential to serve as a basis for such a device. The term Spectroscopy 1 describes a collection of physical measurement methods, which use electromagnetic radiation in the interaction with matter to derive specific properties of the given matter. It goes back to Newton, he used it for the study of light spectra. Spectroscopy can be a plenty of things, from the idea of astronomical spectroscopy (great book for all hobby astronomers: 3) and up to the idea of studying chemical properties of molecules, like tools such as ATR spectroscopy 4. In principle, the methods I have mentioned are based on using a light source with a certain wavelength to trigger oscillations in the substance, tissue or whatever. After the sample has been measured you can start to characterise them by means of references spectra.
Digital Spectral Pathology (DSP)
In the given example I’m talking about the idea of using spectroscopy as tool to find pathologically altered regions in tissue sections 5. The idea is quite interessting because the data you get out of a mircro-spectroscopy device is the microscopic picture at every certain wavelength of the used light source. Basically, you get an image with excited tissue per wavelengths. This results in the spectroscopic characterisation together with the microscopic image. The latter is the only source of data that the pathologist looks at. But beside the image and the given localization of the pathologically altered region you get an integrative signal of all the chemical signals (DNA/RNA) at the point. From Fig.1 you can see what the specific scattering does in such samples. You see raw spectra from one specific class of tissue in Fig.1A) and in 1B) the corresponding spectra after their model-based correction. The latter on looks to me more like the mean, which you can see as a ornage curve in the plots.
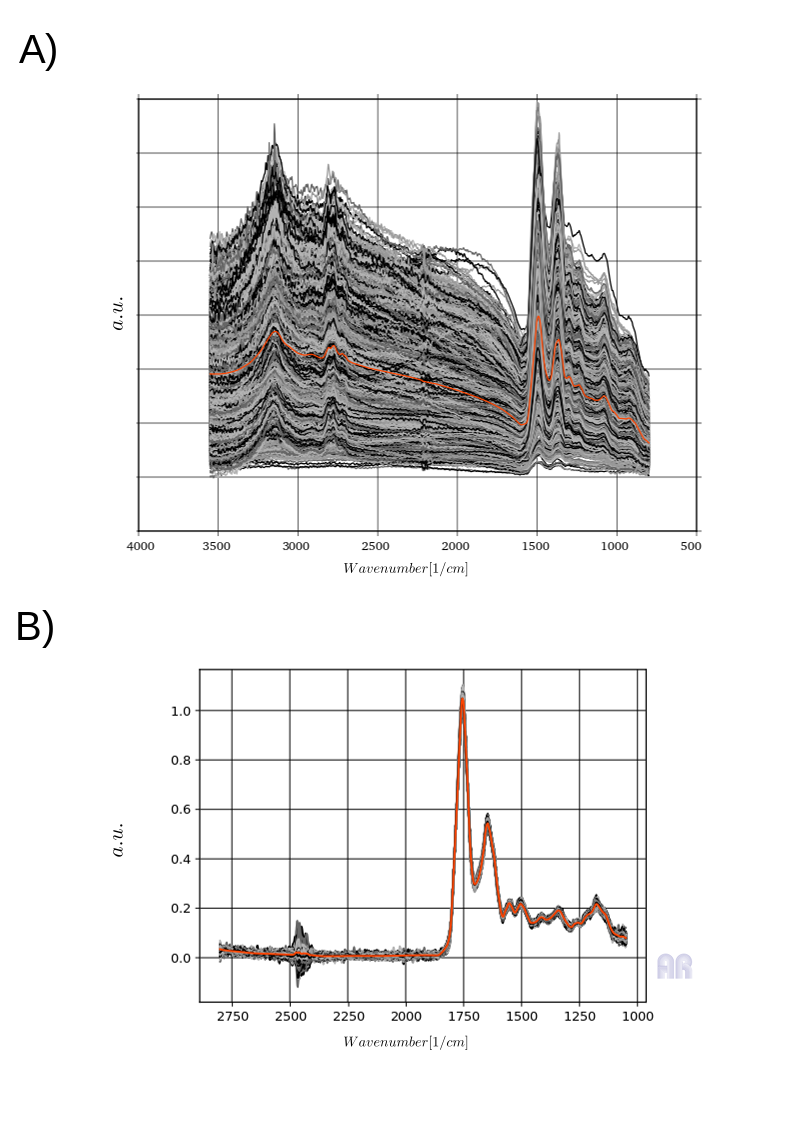 Fig.1
The label is based on a process in which the pathologist was shown classes of spectra which were generated from the kmeans of spectra. From the related areas between cluster analysis and pathologist, training spectra for different classifiers were then separated for after preprocessing.
Fig.1
The label is based on a process in which the pathologist was shown classes of spectra which were generated from the kmeans of spectra. From the related areas between cluster analysis and pathologist, training spectra for different classifiers were then separated for after preprocessing.
DSP and the Machine Learning Perspective
From the point of view of machine learning, we are dealing with a really interesting task here. An extremely large data set, which already contains a large number of explanatory factors at the individual pixel level. In addition, the individual pixels are very noisy, which results from a specific scattering effect (Mie Scattering) that is associated with the irradiation of infrared light with a certain cell size. Furthermore, the point of the the so called “Curse of Dimensionality” comes here into play. We must bear in mind that many areas in these signals can only be partially actually interpreted by a domain expert. Areas of high scattering or integrative signals of many explanatory factors rule this out. This is the reason why we work here with the top label, the annotation by the pathologist. Based on the fact that the data with more variation gives more information, I used the pretrained procedure to disantalge all the given explanatory factors. Which was the only one that really worked with a data set full of noise and multiple explanatory factors. Another very interesting question for machine learning is how the labels were generated, because in the context of semantic segmentation, individual areas are the ones that are examined. Due to the high assumed source of error, unsupervised pretraining was way to go. Most of the stuff was part of my dissertation.